
Tuesday
Oct132009
Modeling Variability
A recent project highlighted that sometimes you need a different way to look at process time variability. The normal practice of gathering, analyzing and entering process times into SIMUL8 just did not work. The normal method would be:
- Collect data into a spreadsheet.
- Manipulate the data if necessary to get it into the form of minutes per work item.
- Paste the data into your favorite statistical software to identify the distribution which best represents the variability of your process.
- Enter the resulting distribution into SIMUL8 as the given work center's operation time.
We developed a simple work-around using SIMUL8's Visual Logic.
Application
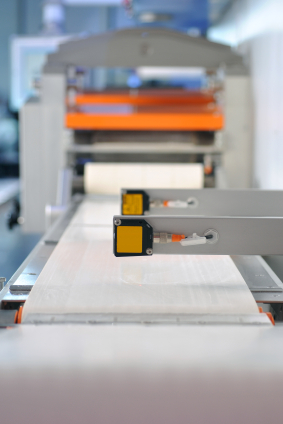 We were modeling an inspection line where pieces were loaded to a conveyor belt that moved the pieces to one or more inspectors. Piece by piece, the inspector would determine if the piece passed or failed. If the inspectors fell behind the speed of the belt, the belt would stop when a piece reached the laser eye control at the front of the conveyor. Sounded simple enough.
We collected data through a PLC to capture the pieces per hour that the inspection line was running. This was done by count the number of pieces of product that went by laser eye counter during each 2 minute interval. From this we could easily calculate the number of seconds between pieces. For example, if 10 pieces were counted in 2 minutes, the rate would be 300 pieces per hour or 12 seconds per piece. Since the collection was all electronic, we continued the data collection for quite some time until we had a very large sample size which included different products, different shifts, different number of inspectors, etc. In the end, it allowed us to gather a large number of observations in the format of seconds per piece per inspector.
Problem
After calculating basic statistics such as average, standard deviations, minimum, maximum etc., we proceeded to the distribution fitting step. With a significant number of observations of good clean data, a very good data fit was found. So far, so good. Next, after we added the distribution parameters to SIMUL8, we started the validation process.
The pieces per day, units per hour, and all averages that could be calculated validated within 1 or 2%. More good news and self-congratulation. Then we started to look at the variability. The data suggested that the system's hourly variability should be somewhere around plus or minus 20 percent. However, in the simulation model, the variability was nearly zero. Why such a difference?
It turned out that the trouble was that when the simulation samples the process time distribution several hundred times each hour the variability is simply washed away by the sheer number of observations. Our model would not validate because we could not match the varaibility of the real world.
Solution
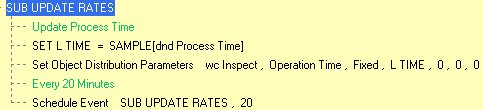
After some quick thought, we concluded that we simply can not sample the distribution for each piece as is SIMUL8's default process time methodology. Instead we tried writing some quick Visual Logic to sample a distribution every X number of minutes and update the work center's process time with a fixed distribution. The work center would then use that fixed process time for the next X number of minutes at which time a new random sample would be drawn.
The next step was to determine the interval that would allow SIMUL8 to mimic the variability found in the real sample. We tried intervals ranging from the original 2 minute data collection window up to 4 hours. 20 minute intervals proved to provide the best match to the real system's variability.
Summary
Instead of sampling a process time distribution for each part on an inspection line as is SIMUL8's default methology, the most accurate validated simulation model had the process time being resampled every 20 minutes. Within each 20 minutes, the process time would remain exactly the same.
Sample Visual Logic
tagged  Data Collection & Anaylysis in Data
Data References (2)
References allow you to track sources for this article, as well as articles that were written in response to this article.
-
Response: top search engine rankingSimulation-based solutions from Novasim - SIMUL8 Experts - Learning SIMUL8: The Complete Guide to Simulation - Modeling Variability
-
Response: пиротехникаSimulation-based solutions from Novasim - SIMUL8 Experts - Learning SIMUL8: The Complete Guide to Simulation - Modeling Variability
Reader Comments