

SIMUL8 2010 - Notable New Features
SIMUL8's latest edition has just been released. Here are the details on what we think are the most useful new features.
Entries in Professional (6)
Tuesday
Apr132010
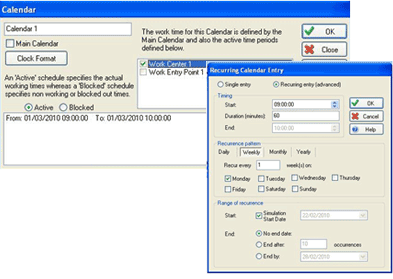
Dynamic Calendars for Objects
SIMUL8 2010's new object calendars let you turn simulation objects (including resources) on or off according to a date-based availability pattern. Calendars also allow you to tie your simulation directly to a specific date. For example, you can start your simulation on Jan. 1, 2010 and have all work centers shut down on Dec. 25, 2010.
The calendars feature recurring events (daily, weekly, monthly etc.) and are fully supported by Visual Logic, so you can completely configure and control your calendars even at run time.
We think that many users will find this to be a very useful and convenient capability.
tagged  Exceptional, Professional
Friday
Apr022010
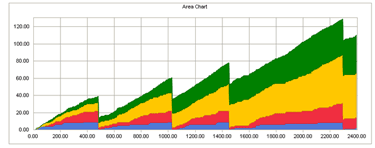
Stacked Area Charts
A new chart display option has been added to provide 'Area Charts'. Area Charts give a proportional view of result totals. The chart series are plotted on top of each other (stacked). This chart type is very useful for visibly comparing one series against another.
tagged Professional
Friday
Apr022010
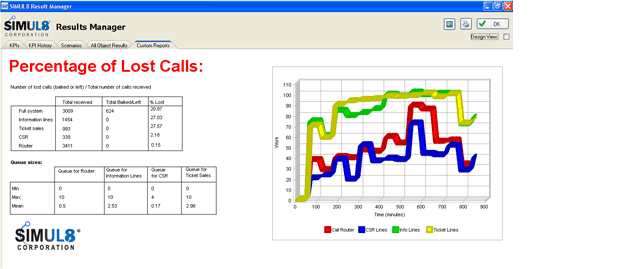
Enhancements to Custom Reports
Custom Reports let you automatically create professional reports to help you effectively communicate the results of your simulation. Improvements inculde a new text format palette, image drag-and-drop, and the ability to insert tables. You can create as many custom reports as you like.
Also included is a new Visual Logic event that runs before a report is opened. This allows you to dynamically adjust the content of your report, giving you total control and flexibility.
Enhanced custom reports are available only in the professional edition.
tagged Exceptional, Professional
Friday
Apr022010
Spreadsheet Based Charts
Although SIMUL8 has had charts in their internal spreadsheets for more than 10 versions, they were not dynamic. This meant that your chart would only remain correct as long as the number of data points didn't change.
SIMUL8 2010 solves this problem by allowing you to dynamically create charts from data stored within SIMUL8 internal spreadsheets. The new dynamic charts also allow for totally customized axes, data ranges, series and points. This gives you complete control over your charts at run time.
tagged Exceptional, Professional
Friday
Apr022010
Gantt Chart Views of Shift Patterns
You can now view all shift patterns side by side in an easy-to-understand Gantt chart view. This is a big improvement over previous editions, which required you to return to a long list of individual shift patterns.
Even better, when you make changes to shift patterns, you can instantly see the outcome on the new Gantt chart.
tagged Professional