

Wednesday
Sep302009
From Mill to Customer: Simulating a Multi-Mode Distribution Network

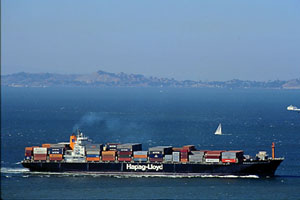
 Norske Skog, Canada's Newsprint Division, is a high volume manufacturer of newsprint. With a heavy and bulky commodity and customers widely dispersed throughout the world, shipping is a significant cost center for the company. In 1999, for example, Norske Skog (then Fletcher Challenge Canada) spent in excess of $100 Million in freight charges. While already a successful distribution system, it was clear that even minor improvements in the efficiency of the overall network would lead to significant cost savings. In addition, management faced a number of operational decisions including such pivotal and risky items as whether to add new distribution facilities. Finally, Norske Skog's transportation system involved several decision points, multiple modes of transport and a geographically diverse cost structure. Given these factors, it quickly became clear to management that an analysis tool would be essential in helping to make ongoing policy and operational decisions.
 A distribution network analysis model was developed to fill these needs with the following primary objectives: (1) provide an exploratory tool that would help the company better understand how existing policies affect inventory levels, shipping lead times, and cost per metric tonne, (2) aid in the design and evaluation of new policies that would reduce cost while maintaining an excellent customer service record, and (3) serve as a platform for evaluating the costs and benefits associated with adding or closing various distribution facilities.
The core development team consisted of an in-house business analyst from Norske Skog's Supply Chain Department and two modeling specialists. Working closely together and within an aggressive time frame, the team put together a detailed set of model requirements for both the technical aspects of the model, as well as its usability. Because the network is very dynamic in nature, and necessarily involves a high degree of random variation, the project team determined that discrete event simulation was a natural fit. In its initial version, the model picks up finished orders as they are produced at the source plant, and follows them as they proceed through the network to the customer. Along the way, orders may travel by barge, large vessel, rail, truck, intermodal or any combination of the above. Each method of transportation has specific capacity constraints and costs that may vary from region to region, and even from customer to customer. Because a primary goal was to enable scenario evaluation of these many factors, the simulation model was built to enable it to use a detailed database of individual customer information.
After analyzing the model's intended use, likely user profile, and project goals, it became immediately clear that the user interface would greatly influence the success of the project. The model was designed to act as a day-to-day decision support tool and would likely be run by users with only limited exposure to simulation. "Because one of the primary project goals was to evaluate the effects of structural changes on the network, this meant that an interface had to be developed that gave users the ability to change not only parameters, but also make structural changes to the model, without having to delve into the simulation code itself. An additional goal of the interface 10.0 was to allow for easy distribution of model scenarios and accompanying results in a format that is commonly accepted and understood by Norske Skog personnel. To accomplish these goals, the distribution network simulation engine was developed in SIMUL8 while the interface was developed using Microsoft VBA and Excel 2000. End users can perform all needed parameter and structural changes to the model from within the Excel / VBA interface with the confidence that these changes are automatically translated and transmitted to SIMUL8 via COM links.


With years of expertise in managing Norske Skog's supply chain, the in-house users of the system were clearly in the best position to use the system to their full advantage. The model's design allowed subject matter experts to freely experiment with the model quickly, inexpensively and without fear of "contaminating" the carefully developed simulation model. In a way, the model provided a laboratory for Norske Skog's supply chain analysts to test their ideas. The project team therefore feels that while the simulation model was very detailed and produced high quality statistics, it was the design of the interface and reports that truly allowed the system to reach its full potential. Today, the system is being successfully used as an on-going decision support tool. Detailed tests against historical data have shown that the tool is surprisingly accurate in predicting the costs associated with each scenario.
 Supply Chain